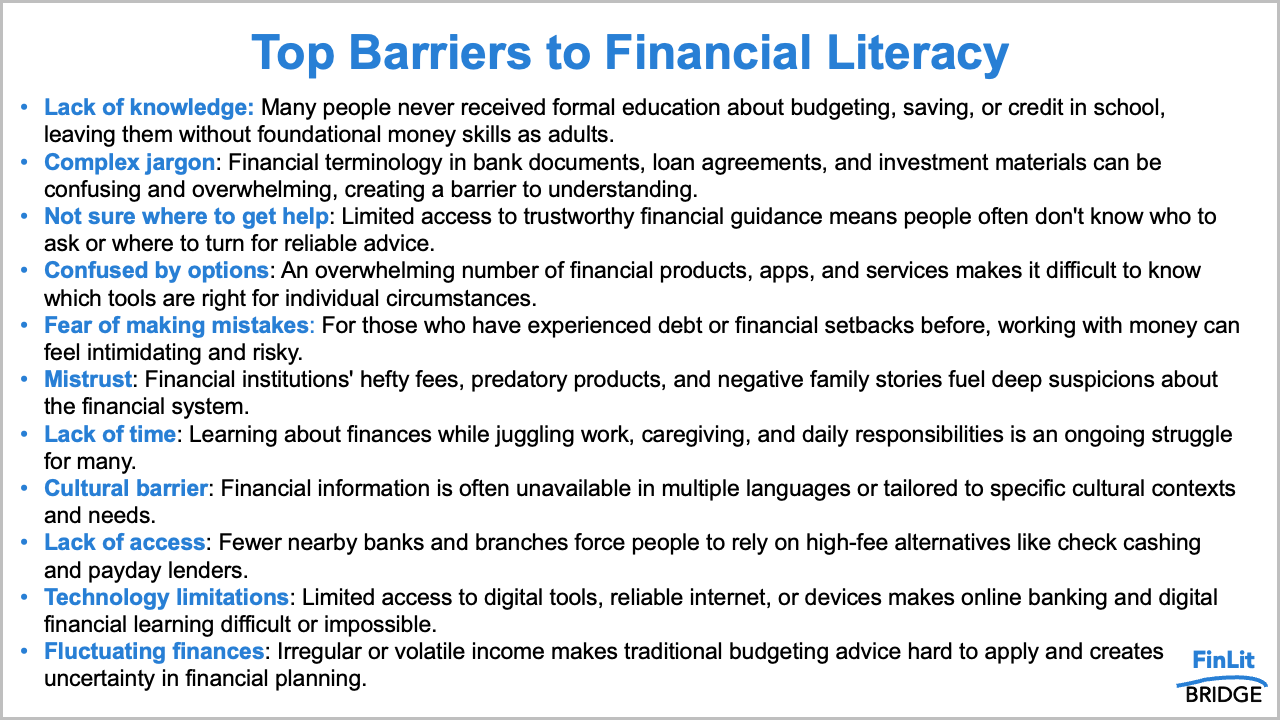
move beyond busy bullets
Good content doesn't always need editing—it needs reorganizing. This real-world makeover shows how restructuring a bulleted list improves both scannability and comprehension.

explaining your job is a data storytelling opportunity
Your job title isn’t your job! Cole shares three practical storytelling techniques to help you explain what you do.

we’re hiring: join the storytelling with data team
Exciting opportunity: we’re adding to the SWD team! Click to learn more and apply.
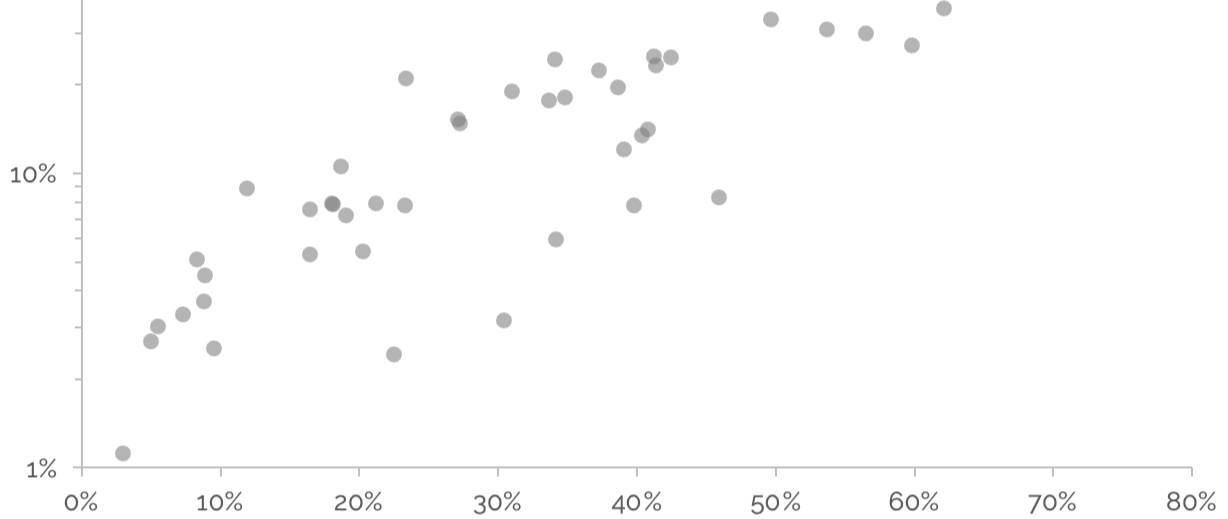
don’t let your axis scales distort the story
One of the most common pitfalls in data visualization is manipulating axis scales in ways that distort the story. This article explores alternatives to log scales.

looking ahead with intention
A new year is an ideal time to set clear intentions and invest in skill development. If communicating more effectively with data is one of your priorities, Cole shares a number of ways to learn with SWD.

at year’s end, a fermata
As we hold here at year’s end in this moment of reflection, we’re feeling grateful for the challenges, the connections, the people, and the progress we’ve made.

interesting data is probably wrong
Surprising data isn’t always insightful—it’s often just wrong. A quick lesson in humility, timestamps, and Twyman’s Law.

mind the gap: how to represent partial data
When sharing data for an incomplete reporting period, being deliberate about context will avoid confusion. Read how to take care to differentiate between complete and incomplete information with thoughtful design changes.

celebrating a decade of storytelling with data
The 10th anniversary edition of storytelling with data is here—with refreshed examples, new insights, and a live celebration event you won’t want to miss!